Two colonies can experience the same spell of weather and still show very different changes on the scales. In this conversation, Grant, a beekeeper and tech enthusiast, compares readings from a Buckfast and an Obsidian colony to see how they built up in spring and what happened when the rain returned.
The difference looks striking, but it is a snapshot of one Obsidian and one Buckfast in one location. It is not a controlled trial or a verdict on either queen line. The weather, hive work and stores all matter when you read the graphs.
What this episode covers
- What hive-scale readings can show about nectar flows and stores
- How Grant’s Buckfast and Obsidian colonies changed during a short spring period
- Why a single comparison cannot tell you which queen line is best
- What to record before making decisions about honey or stores
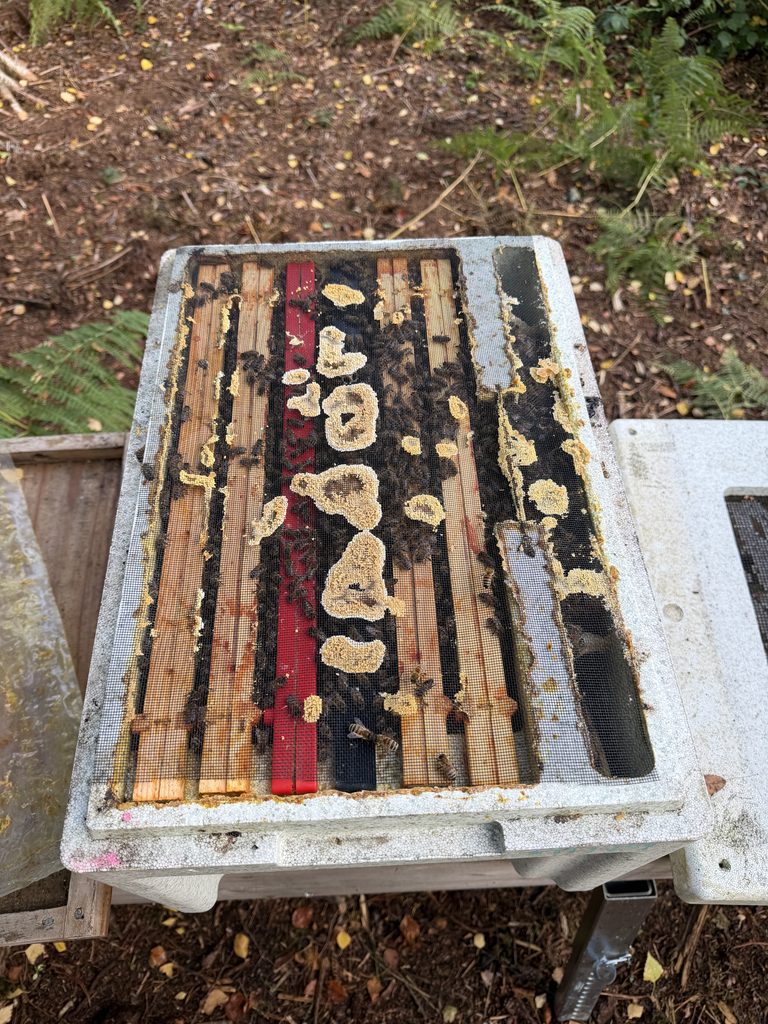
- The extra propolis Grant noticed with his Obsidian bees
Hive-scale readings need context
A scale records weight over time. That number becomes more useful when you compare it with the weather and your hive notes. Grant wanted to know when the nectar flow had ended, when to take supers off, and whether his colonies were using their stores.
He set the weight graphs beside rainfall and temperature. That helped him see when the bees gained weight, held steady or began to lose it. It also showed why a single reading can mislead you. The reason for a change may be something you did in the hive.
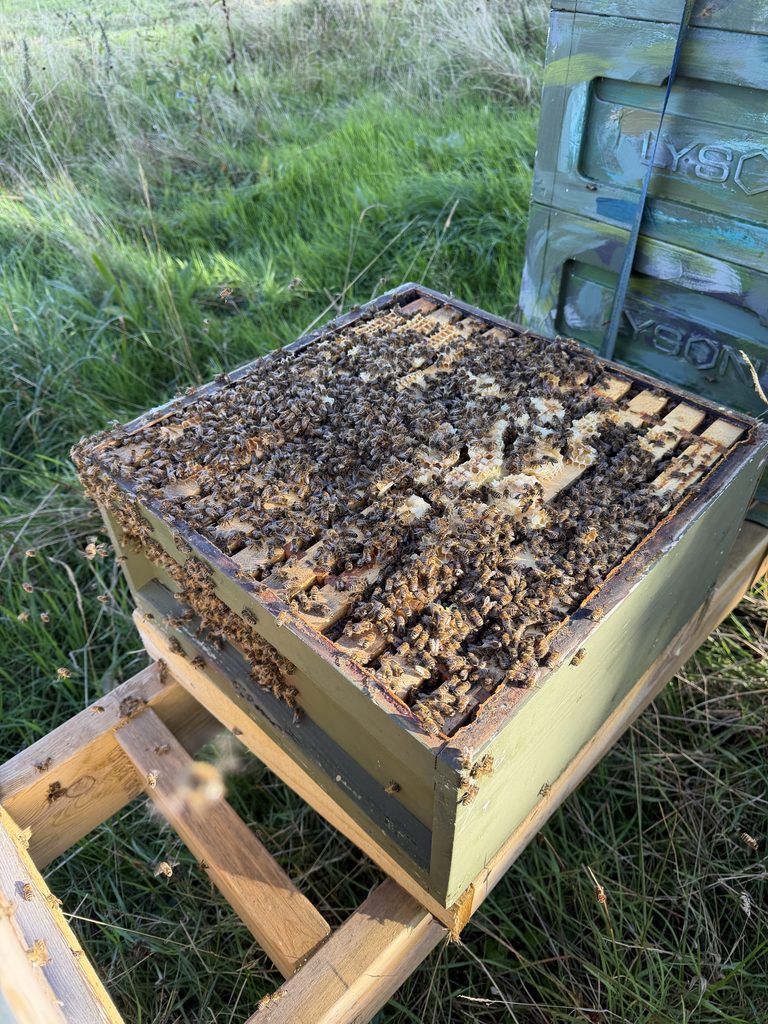
Grant’s colonies were in the same type of Abelo 12-frame box, on 14 by 12 single brood boxes. He checked his notes during the conversation and confirmed that each had one super on by 17 May. Those details help make sense of the comparison.
Around the end of May, Grant gave the Obsidian colony a frame of stores. You can see a sharp change in its weight on the graph. That increase came from the frame he added, not from nectar the bees had collected. Grant said that, if he had seen the readings sooner, he might have used that frame elsewhere.
Keep a note of changes like this. Adding stores, removing honey or moving equipment can all affect the weight on a scale.
What changed when the rain arrived
Grant looked at readings from 17 May into June. After the rain eased and temperatures rose, the Buckfast colony gained weight quickly. Its reading moved from about 26 kilos to around 28.5 kilos by 22 May, a gain of roughly 1.5 kilos in a day.
The picture changed during a wet spell from 1 to 11 June. In Grant’s graph, the Buckfast colony fell from just over 30 kilos to about 27.5. The Obsidian stayed around 31.5 to 32 kilos. Grant thought the Obsidian bees were making better use of gaps in the poor weather.
That is an interesting result, but the added frame of stores affects the comparison. The two colonies did not have identical histories. The graph suggests a difference in how they behaved during that period, but it does not prove that every Obsidian colony will forage better in rain.
That is where measurement helps. It gives you more context for a decision, rather than a fixed answer that works everywhere.

One comparison cannot pick the best queen line
Grant’s first comparison covered only a short part of the season. He later moved the Obsidian colony into splits, so the test did not continue as a planned trial. He said he would set up a more deliberate comparison the following year.
A separate graph showed two Buckfast colonies in similar setups. One produced close to 100 kilos of honey, while the other produced about 85. Grant used that example to show how much colonies can differ, even when their equipment and starting conditions look alike.
He also wondered whether he had removed honey too early. He was watching for oilseed rape honey to set, but warmer weather arrived later in May. The weight history and the rain that followed could have helped him judge how much honey to take and how many stores to leave.
Laurence also mentioned reports from two other bee farmers who had seen good yields with Obsidian bees.
If you are weighing up queen lines, start with the conditions in your own area. Our guide to British queen bees explains more about choosing queens. You can also browse the queen bee range.
Beekeeping is an art, with useful measurements
A scale cannot make every beekeeping decision for you. Weather, location, forage, hive type and the individual colony all shape what you see. A calendar can give you a broad guide, but local conditions decide what is happening in your apiary.
As Laurence put it, “And actually, guidance comes in the form of context.”
Grant’s project aims to collect hive-scale readings from more beekeepers. The hope is to compare weight changes with local weather and colony notes, then see whether those records can help people make better-timed decisions. The HiveQ community gives beekeepers a place to discuss their observations. The idea was still at an early stage in this conversation, and Grant said a wider test would need a more deliberate setup.
If you keep bees, record what you can alongside the scale readings:
- The date and local weather
- Changes to supers, stores or other equipment
- What you saw during inspections
- How the colony’s weight changes over time
A note about a frame of stores can explain a sudden jump. A run of rainy days may help explain a colony losing weight. The records are most useful when you can see what was happening around the bees.
Propolis is another difference to notice
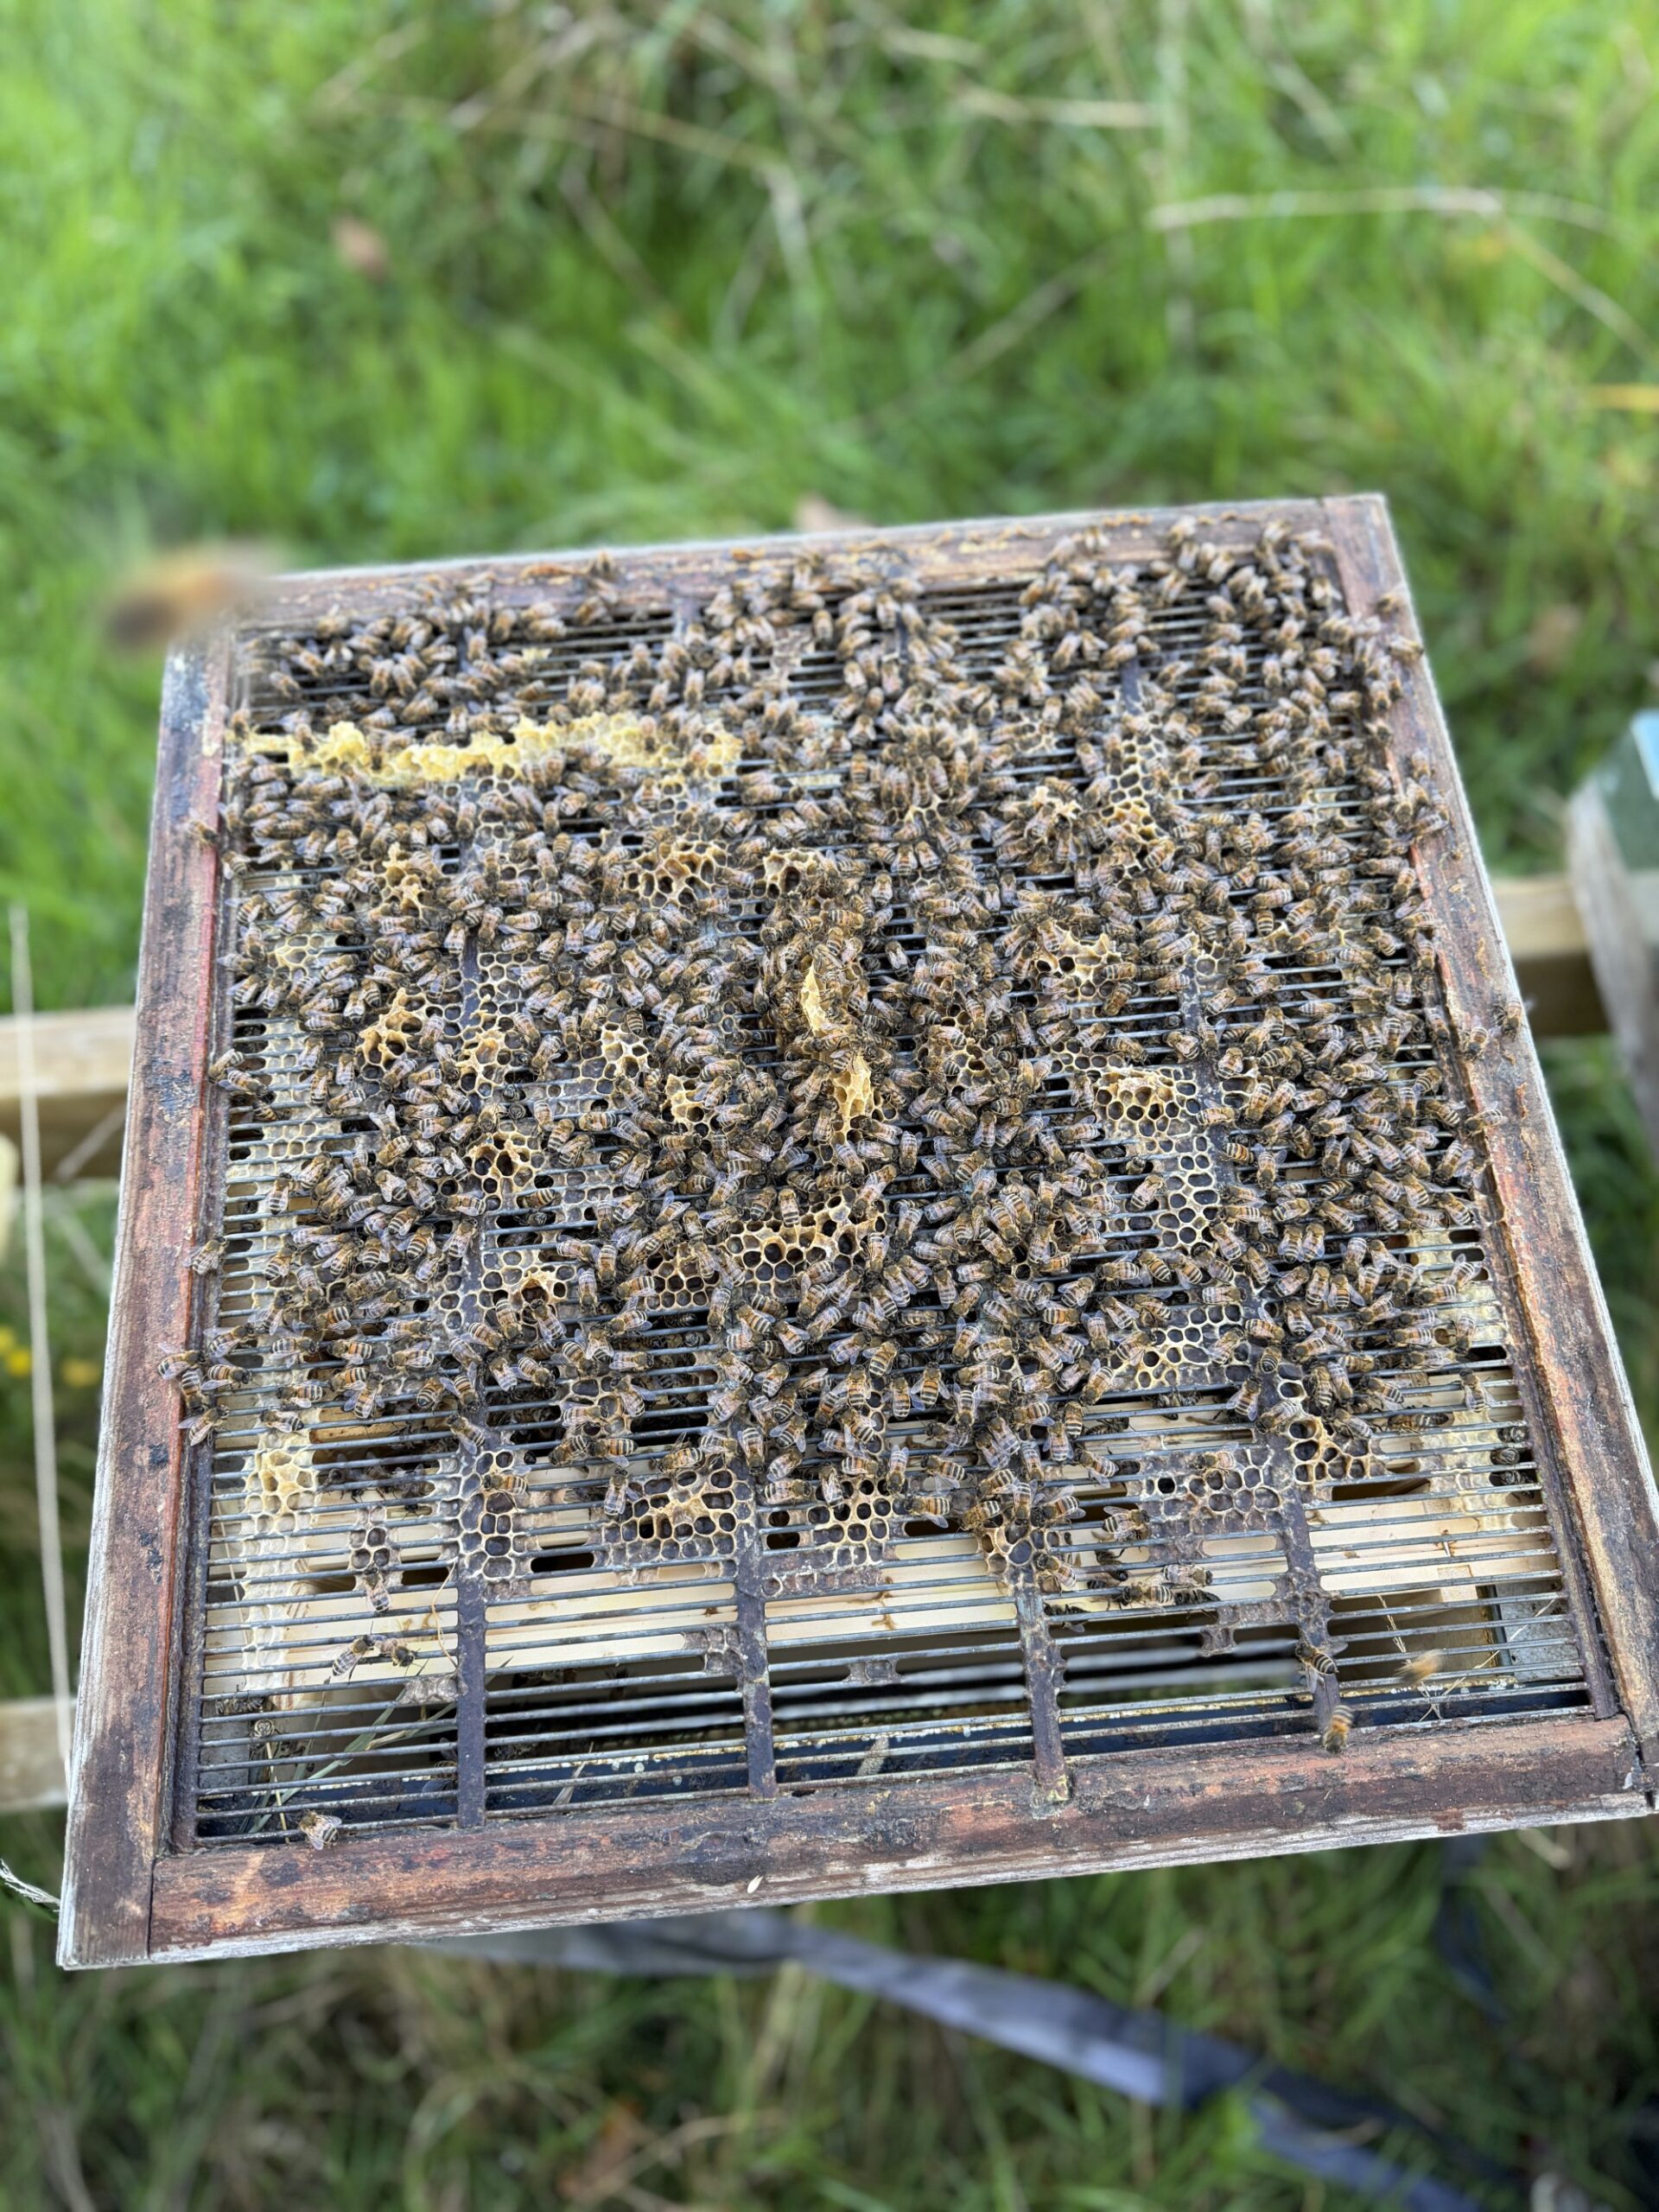
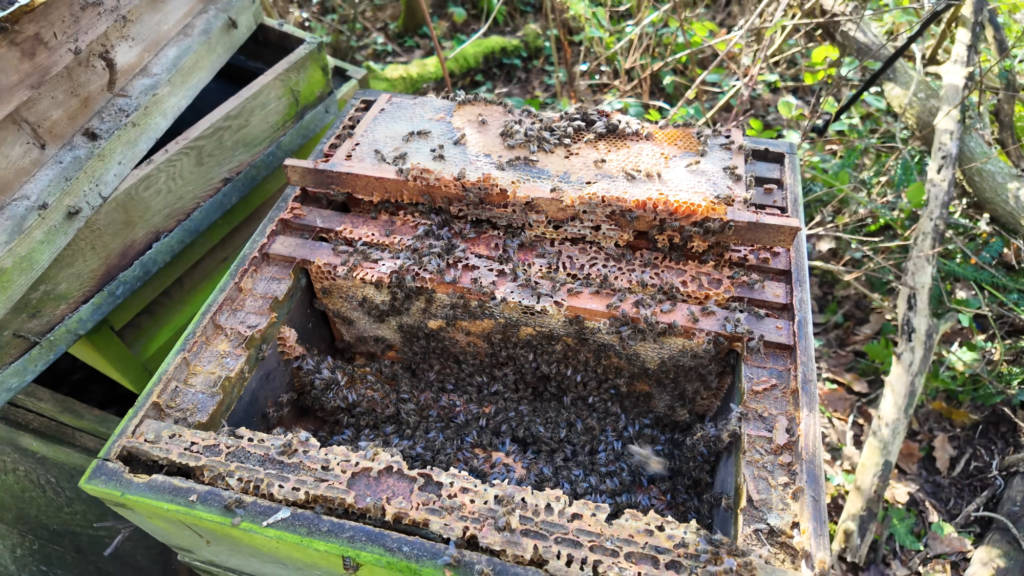
Grant said his Obsidian bees made more propolis than his Buckfast colonies. He scrapes it off with a hive tool. He found the plastic Abelo boxes easy to clean, though propolis can make the queen excluder stick to the super if he leaves it to build up.
It is a small practical detail, but one that can affect how a particular bee line suits your equipment and routine.
Laurence invited people with technical skills, including 3D printing, to get in touch about helping with the hive-scale project. The hope was to build an open-source setup and test it with more beekeepers.